Getting Started
eazyBI is a powerful app for Jira Server, Cloud and Data Center providing easy-to-use drag-and-drop creation of custom reports, charts, and dashboard gadgets. Import your data from Jira Core, Jira Software, Jira Service Management, Tempo, Zephyr, and other popular apps. Visualize and analyze all your data using many chart types, and share reports with your coworkers.
0
First of all, install eazyBI for Jira app to start using it. You might need Jira admin assistance to do this at first. There are more details for Jira admin (or you) on how to set up and manage eazyBI accounts:
Now you are set up and ready to take a different look at your data with eazyBI.
1
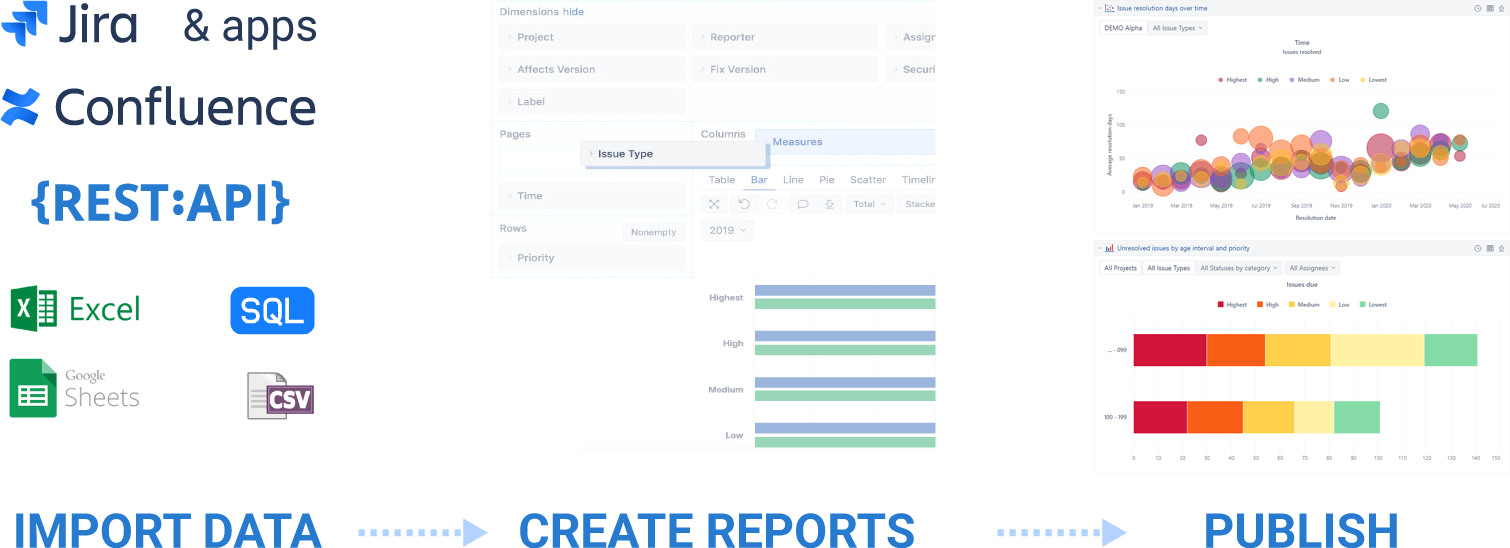
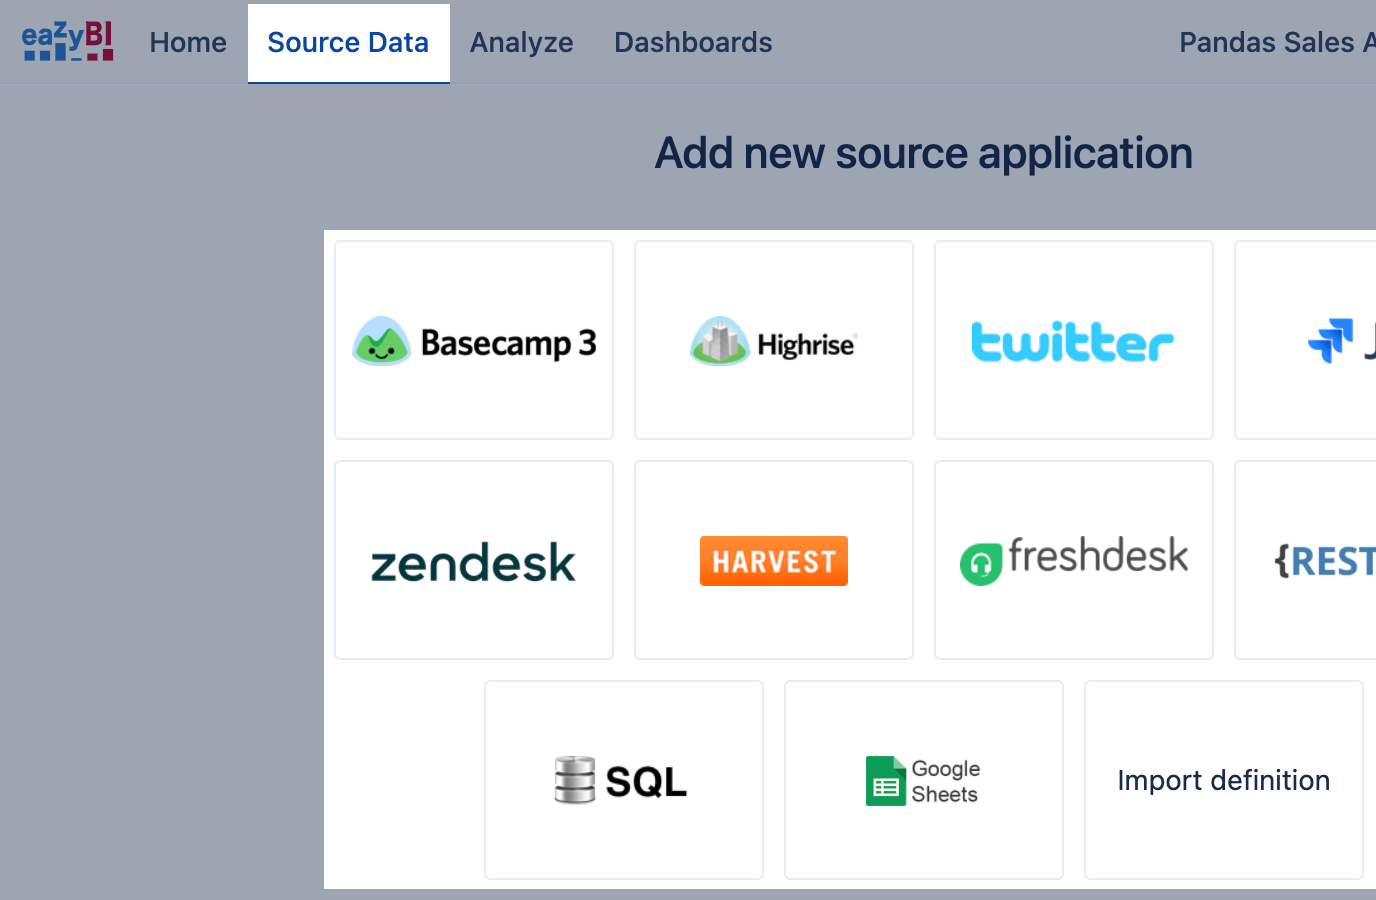
IMPORT DATA
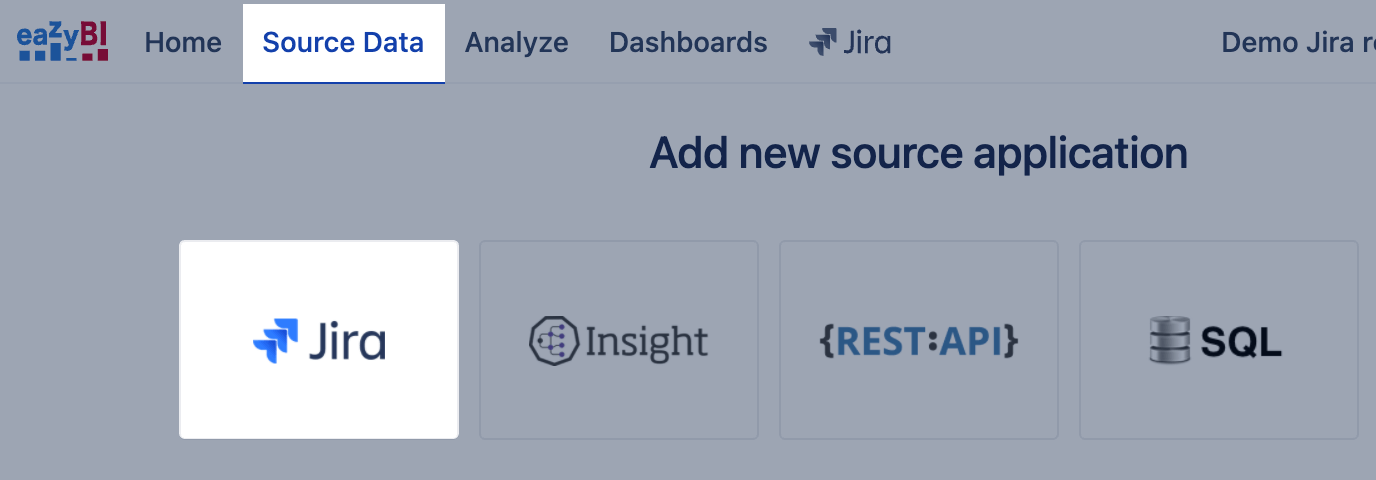
Go to tab Source Data and select data import from Jira. Jira issue custom fields and apps are essential to Jira and give Jira users a lot of freedom. You can import data from those custom fields or apps in eazyBI by selecting them for data import in tabs Custom fields and Add-ons.
This training video might help you catch up with data import basics: Import data into eazyBI (7:57min).
2
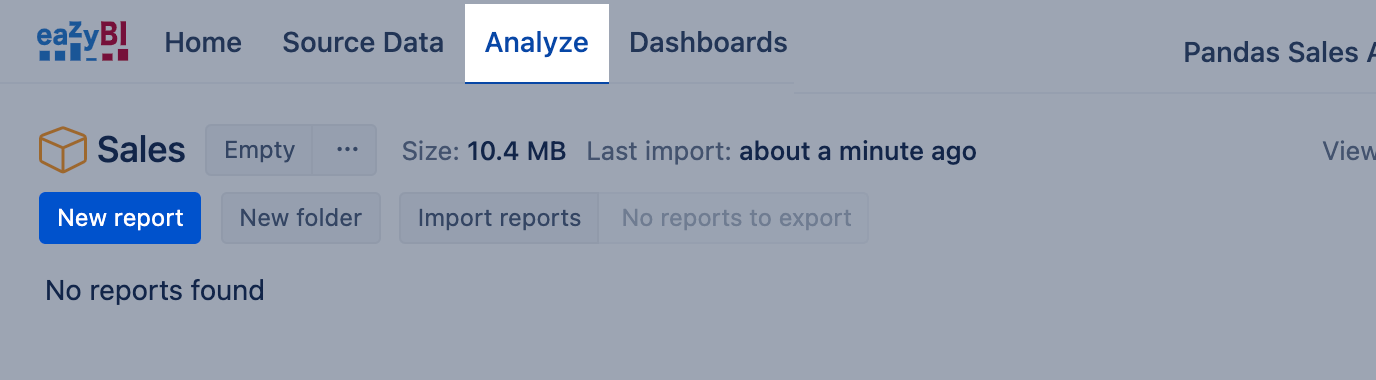
CREATE REPORTS
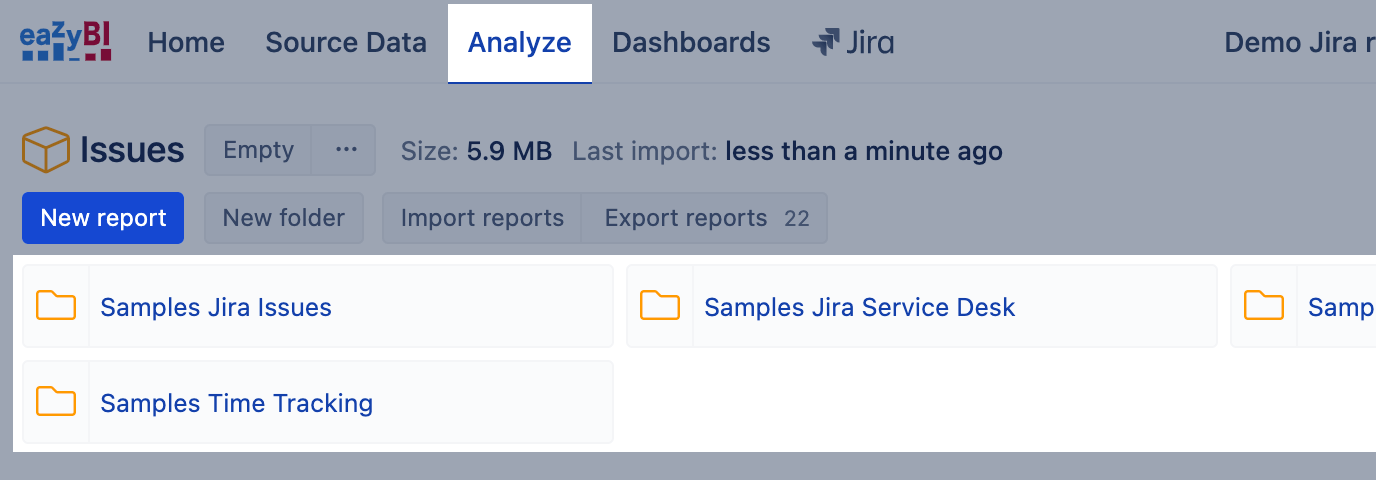
After importing data from Jira, go to tab Analyze and start to explore data by looking through Sample reports or creating New report. It would be essential to understand the report building blocks, measures, and dimensions, before you start creating eazyBI reports.
To help you get started and get more ideas on what you can do with eazyBI, explore more report examples in eazyBI Demo account: https://eazybi.com/accounts/1000/dashboards/. You can easily export and import those reports into your account.
Those training videos might help you catch up: Start building report (11:41 min) and Using charts (part I) (6:13min).
3
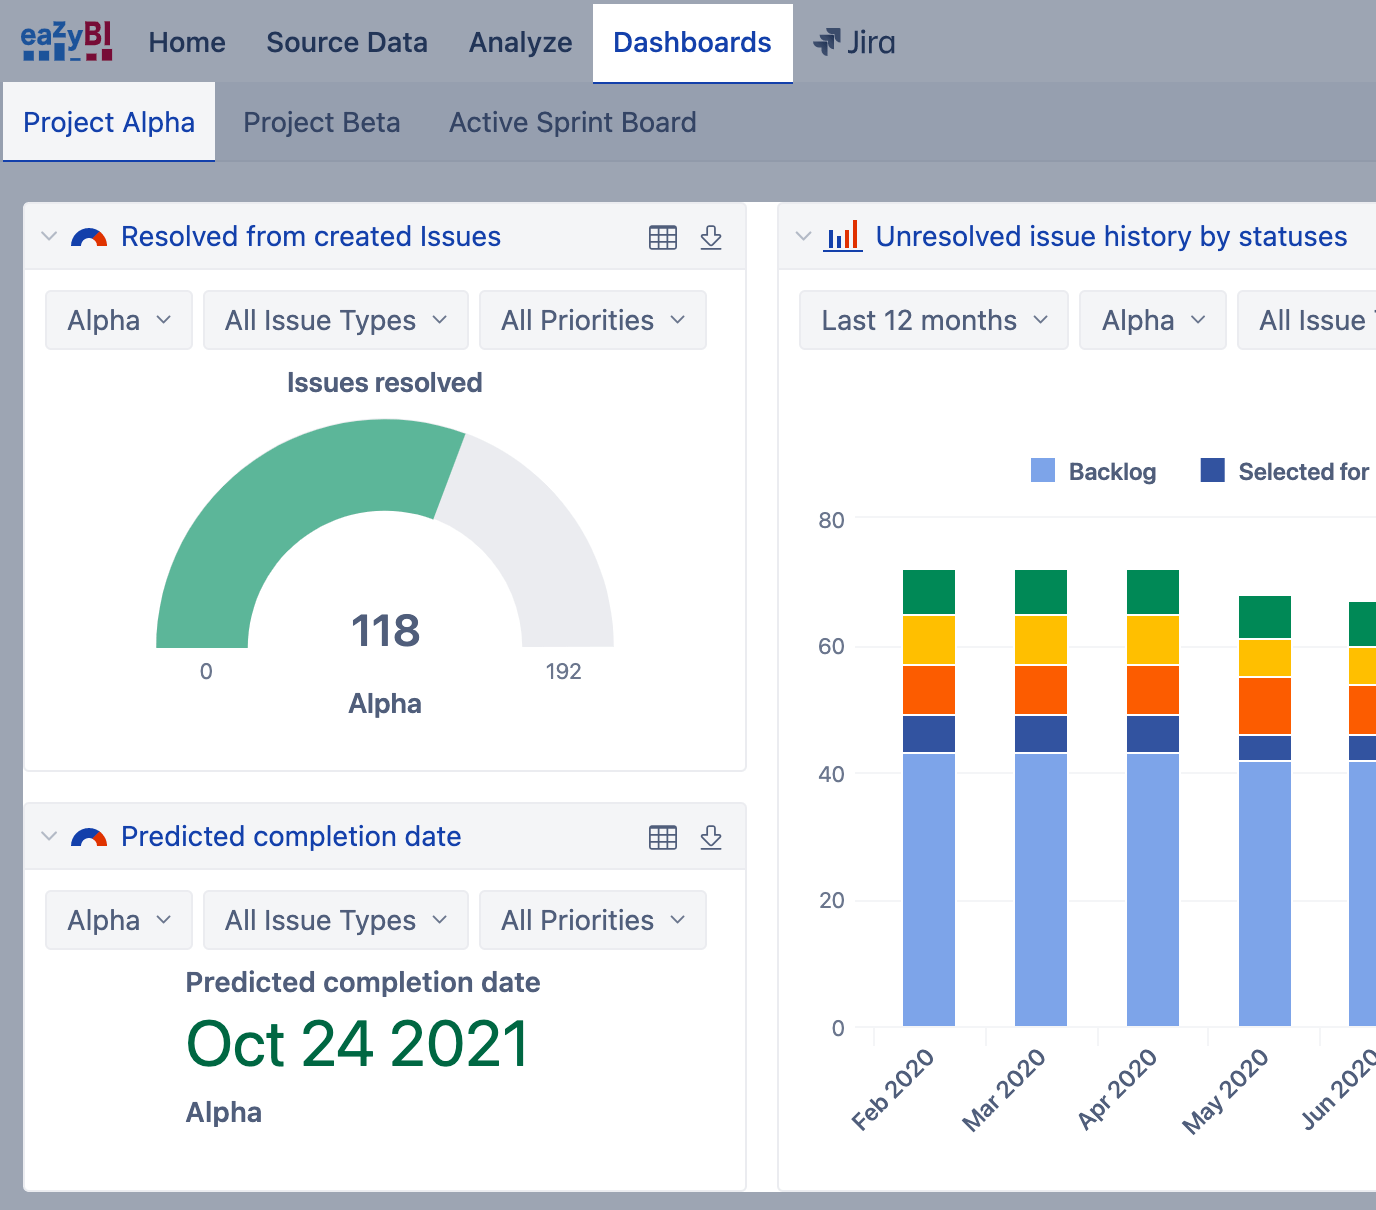
PUBLISH REPORTS
When you have created reports, you can share them with your colleagues, partners, peers, and customers. You can organize and publish reports in eazyBI Dashboards. Also, share reports in an environment where users are working or spending most of their time, like:
- Jira dashboard
- Confluence page
- other WEB pages
- wallboard in a meeting room.
This training video might help you to catch up: Sharing reports (8:18min).
See Also
- eazyBI Community Portal for real-life use cases and solutions.
- Let's get started videos - introduction to the eazyBI basic concepts, first report creation, and publishing with the eazyBI for Jira app.
- Training videos on specific topics - various training topics for different user levels.
- Register for the Getting Started webinar - first steps in eazyBI with demonstration and time for Q&A (live questions and answers).
- Getting Started Email Course - if you are new to eazyBI or just willing to refresh the eazyBI basic concepts, you can subscribe for the getting started email course at any time.
- eazyBI Blog - to keep up on the actualities about eazyBI, recent product releases, customer use cases, and other topics.
- eazyBI Demo account - report templates ready to use.
eazyBI is now available also as an app for Confluence Cloud and Confluence Server (in addition to the popular eazyBI app for Jira). eazyBI provides easy-to-use drag-and-drop creation of custom reports, charts, and dashboard gadgets from Confluence and other data sources. Visualize and analyze all your data using many chart types, and share reports with your coworkers.
0 First of all, install eazyBI for Confluence app to start using it. You might need Confluence admin assistance to do this at first. There are more details for Confluence admin (or you) on how to set up and manage eazyBI accounts:
Now you are set up and ready to take a different look at your data with eazyBI.
1
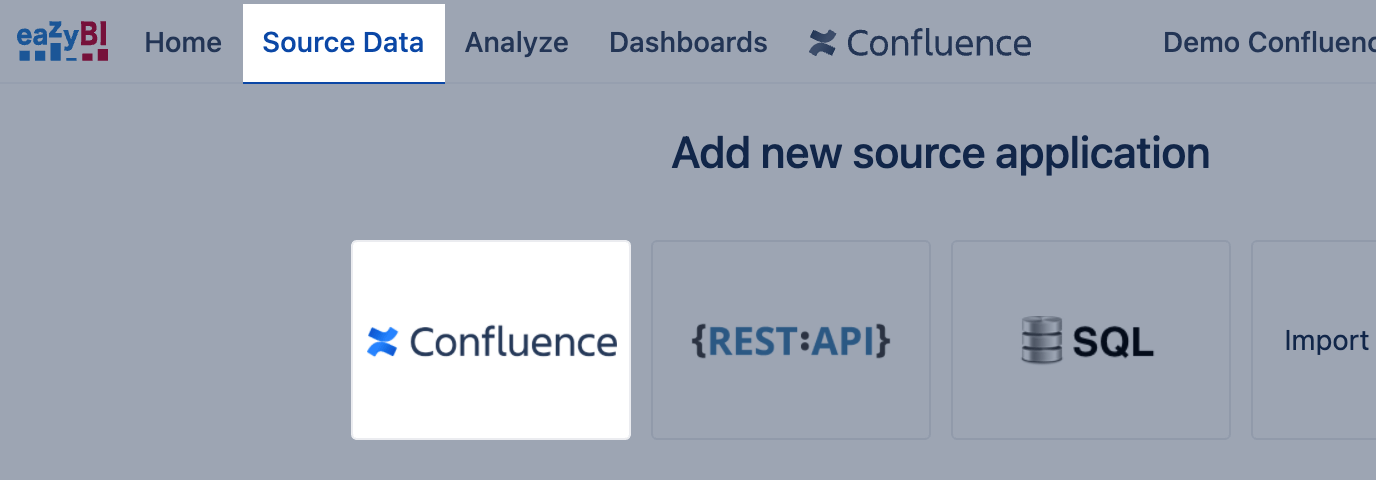
IMPORT DATA
Go to tab Source Data and select data import from Confluence. Select from which Confluence spaces you would like to analyze page events, tasks, attachments, and search queries.
This training video might help you catch up with data import basics: Import data into eazyBI (7:57min).
2
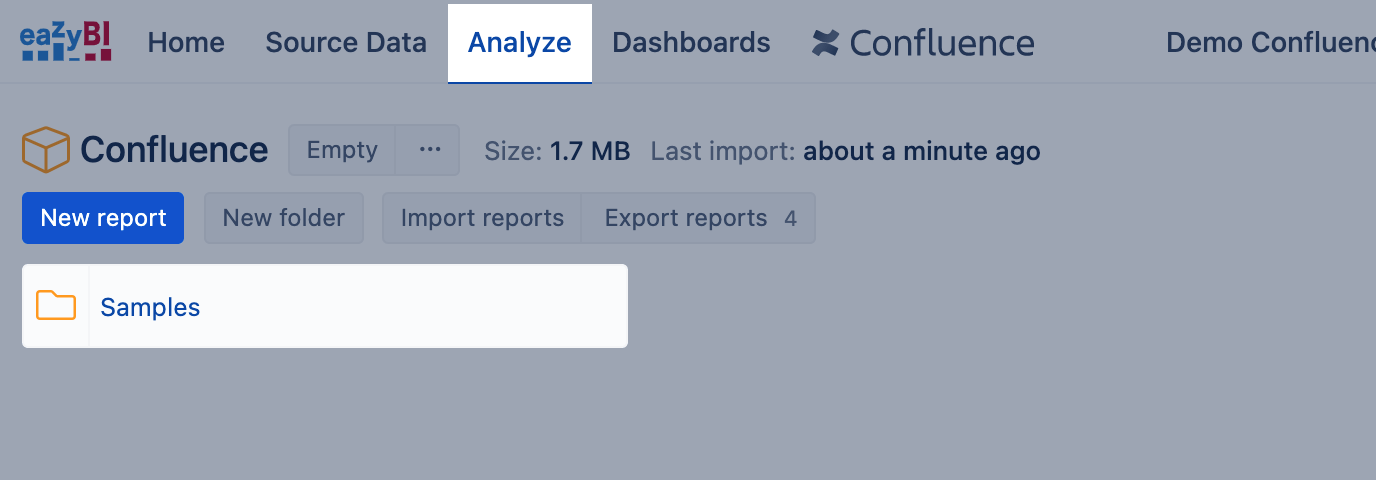
CREATE REPORTS
After importing data from Confluence, go to tab Analyze and start to explore data by looking through Sample reports or creating New report. It would be essential to understand the report building blocks, measures, and dimensions, before you start creating eazyBI reports.
To help you get started and get more ideas on what you can do with eazyBI, explore more report examples in eazyBI Demo account: https://docs.eazybi.com/plugins/servlet/eazybi/accounts/6/dashboards/. You can easily export and import those reports into your account.
Those training videos might help you catch up: Start building report (11:41 min) and Using charts (part I) (6:13min).
3
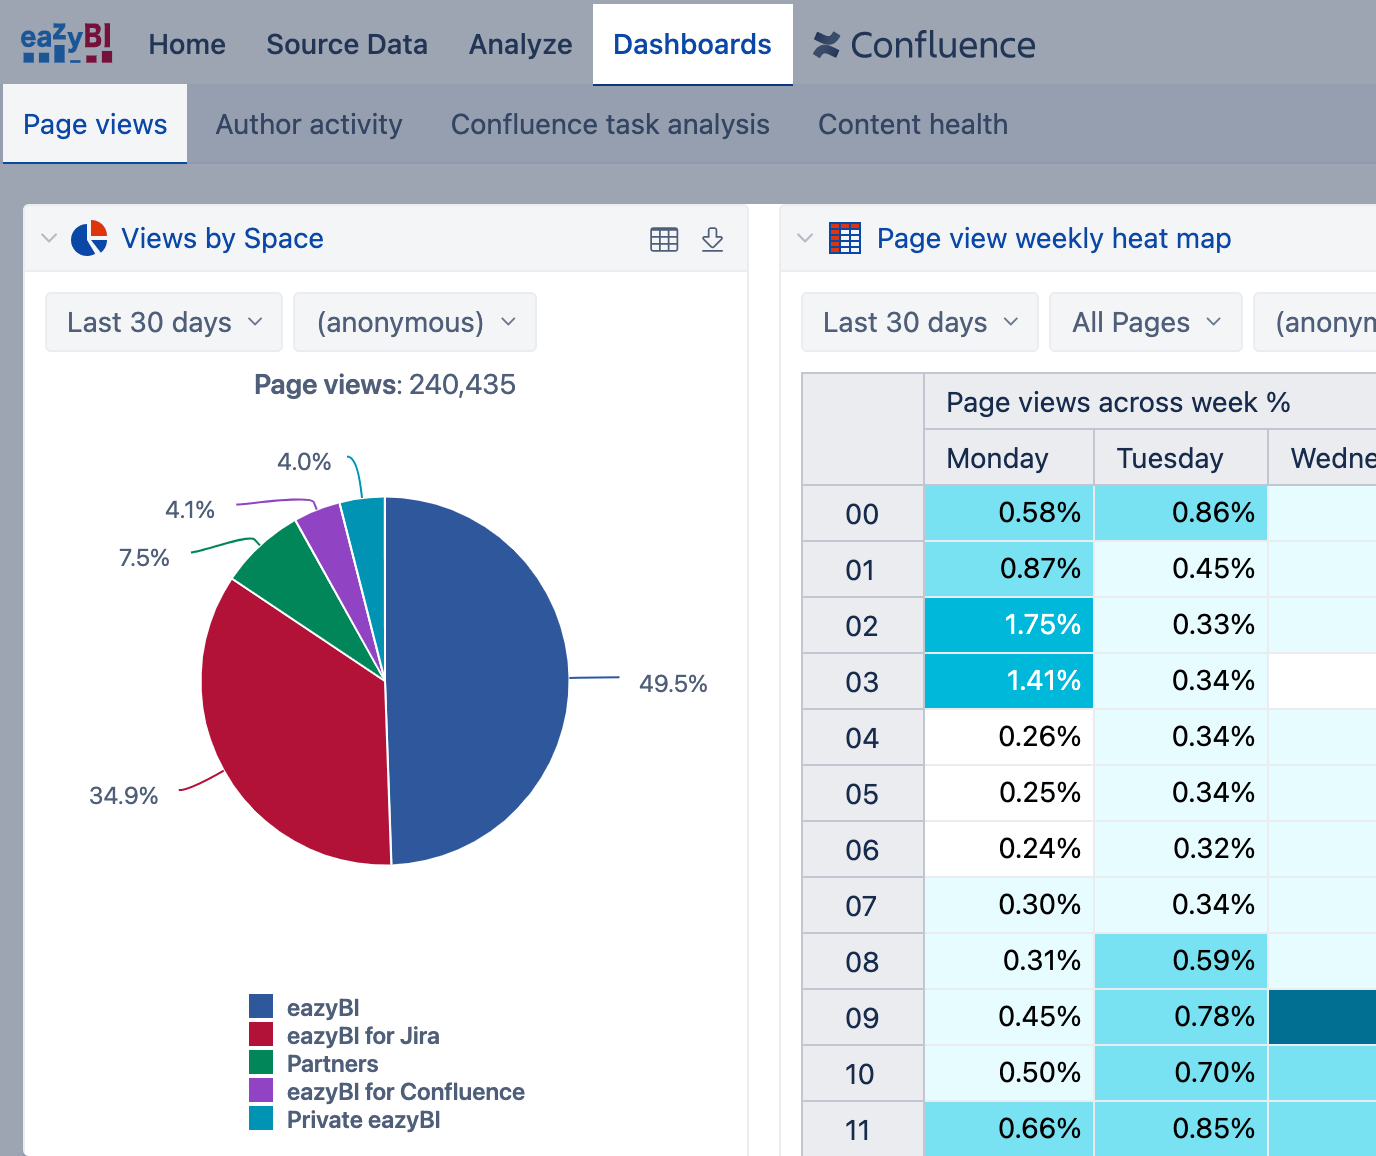
PUBLISH REPORTS
When you have created reports, you can share them with your colleagues, partners, peers, and customers. You can organize and publish reports in eazyBI Dashboards. Also, share reports in an environment where users are working or spending most of their time, like:
This training video might help you to catch up: Sharing reports (8:19min).
See Also
- eazyBI Community Portal for real-life use cases and solutions.
- Let's get started videos - introduction to the eazyBI basic concepts, first report creation and publishing with the eazyBI for Jira app.
- Training videos on specific topics - various training topics for different user levels.
- eazyBI Blog - to keep up on the actualities about eazyBI, recent product releases, customer use cases, and other topics.
- eazyBI Demo account - report templates ready to use and get ideas on how to build reports.
eazyBI is a powerful tool, providing easy-to-use drag-and-drop creation of custom reports, charts, and dashboard gadgets. Import your data from excel, CSV file, Google Spreadsheets or using REST API, or SQL select. Visualize, and analyze all your data using many chart types and share reports with your coworkers.
0
First of all, Create new account to create a data cube and start using eazyBI. You may have several accounts for different data sources and reporting purposes.
There are more details for the account owner (you) on how to set up and manage eazyBI accounts:
- Subscription plans for eazyBI Cloud (eazyBI.com)
- Manage account users who can see the reports and work with them
1
IMPORT DATA
Go to Source Data tab and select data import from SQL SELECT, REST API, Google Sheets, Excel file, or source system eazyBI has an integration.
Map your data columns as you would like to use them in the reports to group data and aggregate quantitative values. Here are some rules to guide you through the data mapping process.
Usually, data mapping is done once when introducing the new data source. Now you are set up and ready to take a different look at your data with eazyBI.
2
CREATE REPORTS
After mapping and importing data, go to Analyze tab and explore data by creating New report. It would be essential to understand the report building blocks, measures, and dimensions before making eazyBI reports.
To help you get started and get more ideas on what you can do with eazyBI, explore more report examples in eazyBI Demo accounts:
- Jira Software Demo account
- Freshdesk Demo account
- Highrise Demo account
- Map chart Demo account
- Sales (CSV) Demo account
- SQL, Rest API, and Google Spreadsheets Demo account
Those training videos might help you catch up: Start building report (11:41 min) and Using charts (part I) (6:13min).
3
PUBLISH REPORTS
When you have created reports, you can share them with your colleagues, partners, peers, and customers. You can organize and publish reports in eazyBI Dashboards. Also, share reports in an environment where users are working or spending most of their time, like WEB pages.
This training video might help you to catch up: Sharing reports (8:18min).
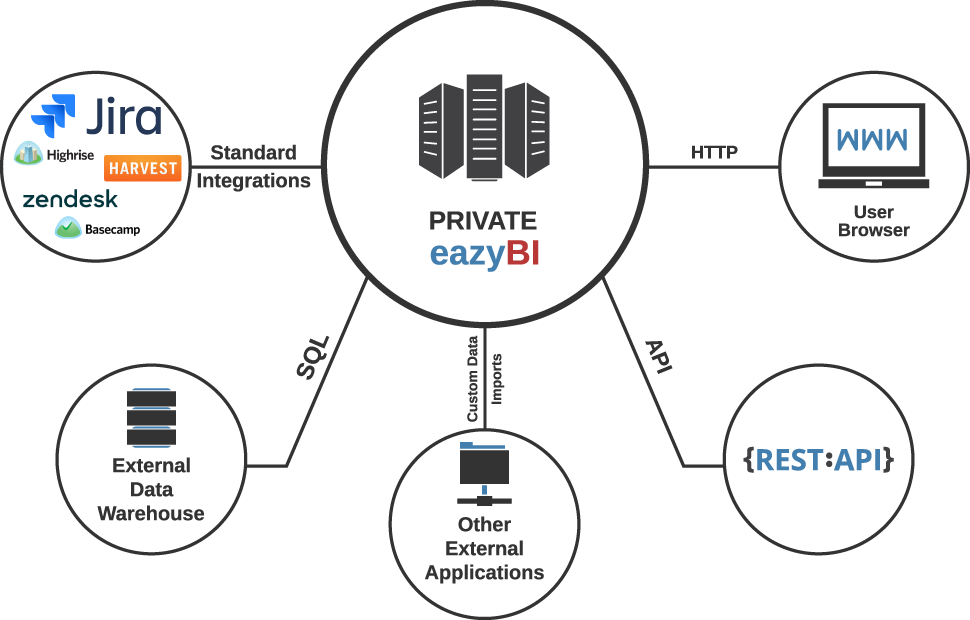
Private eazyBI is an installable business intelligence tool that you can use on your own servers. Use Private eazyBI as your data analysis and reporting extension for your existing corporate applications to create flexible reports and dashboards or to perform extensive analysis and insight mining.
Just map your existing database tables to eazyBI dimensions and measures, and you’re ready to go.
Private eazyBI is easy to install and easy to upgrade. Customize its visual appearance by adding your logo, headers, footers, colors etc. Private eazyBI also allows you to develop additional integrations with other applications.
Please find terms of concept of eazyBI before you get started: